
Dairy laboratory · Cheesemaking
Cheese yield starts with milk: 6 control points from intake to starter culture
Unstable yield, a weak curd or unpredictable acidification may prompt a cheesemaker to investigate the vat. The investigation should start earlier, with incoming milk and its preparation. These six control points help dairy technologists, laboratories and managers connect measurements with process decisions and understand where FOSS analysers fit.

In short
Somatic cells, microbiology and storage
An elevated somatic cell count calls for investigation of raw-milk quality and herd udder health. In the Cheddar study by Auldist et al. (1996), the effect of high cell counts on yield and quality also depended on lactation stage. Supplier history and seasonal trends therefore add context to a monthly average.
Extended storage presents a separate risk. Some psychrotrophic bacteria grow under refrigeration, and their heat-resistant enzymes may remain active after pasteurisation. Paludetti et al. (2020) observed increased protein breakdown with a Pseudomonas fluorescens protease, but no reduction in mean Cheddar yield under the conditions studied. This supports storage and proteolysis control, rather than a prediction of inevitable yield loss in every batch.
LabLog recommends recording supplier, storage time and temperature, somatic cell count and bacterial test results in the same batch record. Somatic cells and bacteria are different measurements. Screen for antibiotics before releasing milk to production as well.
Total protein, casein and fat
Total protein alone does not describe milk for rennet cheese. Casein forms the curd framework: milks with the same total protein can differ in casein proportion and processing behaviour. Compare casein and fat with actual cheese yield and losses into whey.
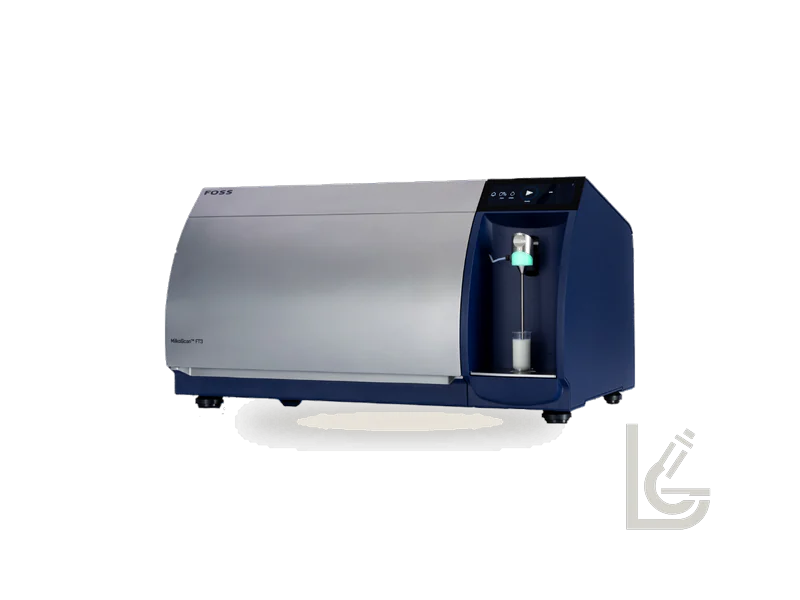
FOSS describes MilkoScan 7 RM as a high-throughput raw-milk system measuring 17 parameters in 6 seconds, including casein and protein. This is a specification for that model, not the entire MilkoScan family. MilkoScan FT3 also offers casein calibrations for dairy laboratory work; confirm the parameter package and sample suitability when selecting a configuration.
An infrared result depends on calibration, sample preparation and measurement control. It does not directly predict cheese yield. Validate any yield calculation against your plant data and compare finished cheese at a consistent moisture level.
Pasteurisation: record temperature and holding time
Tetra Pak gives 72–73 °C for 15–20 seconds as a common treatment for many rennet cheeses. Select the actual process for the cheese, equipment and safety requirements. This is high-temperature short-time pasteurisation (HTST), not low-temperature long-time treatment.
More intense heating alters whey proteins and milk coagulation. However, there is no universal rule that cheese cannot be made above 78–80 °C: cheese technologies differ. Chadikovski et al. (2022) found that increasing source-milk pasteurisation from 72 to 80 °C reduced Urda yield from the resulting whey. That result cannot be applied to every cheese variety.
LabLog recommends retaining actual temperature and holding-time records for each batch. A high bacterial load requires investigation of the milk; raising the temperature alone does not authorise acceptance of a problematic batch.
pH and titratable acidity
pH and titratable acidity describe different milk properties. They are not interchangeable and have no universal conversion formula. Comparisons before and after pasteurisation require consistent sampling conditions and measurement temperature, a functioning electrode and verified calibration.
A difference of up to 0.1 pH unit is not a universal limit or a stand-alone rejection criterion. A larger change calls for checks of the sample, instrument, storage and process. A pH difference alone cannot reliably predict cracks, stickiness or a sour flavour in cheese.
LabLog recommends defining a working range for your product, recording both pH and titratable acidity, and comparing them with successful batches. Use a pH meter for direct pH measurement; use an analyser prediction only with a suitable calibration.
Water for washing curd
Where the process includes curd washing, water becomes a controlled process input. Include its pH in monitoring alongside water-quality requirements, temperature and addition volume.
Do not automatically intensify washing whenever milk pH changes. Changing whey removal and water addition affects the subsequent process; a technologist should approve adjustments for the specific cheese.
LabLog recommends recording water source and test results, temperature, volume and addition stage in the batch log. This helps distinguish raw-material changes from changes in processing.
Starter culture and the acidification curve
A starter is a culture of microorganisms; rennet is an enzymatic coagulant. They perform different functions. Assess starter performance from pH over time at the specified dose and temperature, rather than from a single early reading.
The technical discussion gives working examples of 15–20 minutes for certain frozen and bulk starters and 40–60 minutes for freeze-dried cultures. These are not universal activation times. Culture format, strains and supplier instructions determine when to assess activity. Do not automatically dissolve or rehydrate a direct-vat culture beforehand.
LabLog recommends logging culture name and batch, storage conditions, dose, temperature, addition time and successive pH readings. If the curve differs from expectations, investigate milk, culture and process conditions before changing the recipe.
One-batch checklist
Use one shared identifier for milk samples, process records and finished cheese. Compare results using consistent units, methods and measurement conditions.
Swipe the table left to see all columns.
| Control | What to record | Purpose |
|---|---|---|
| Raw milk | SCC, bacterial results, storage | Batch history and release decision |
| Composition | Casein, total protein, fat; method and units | Compare yield and losses |
| Pasteurisation | Actual temperature and holding time | Verify process compliance |
| Acidity | pH, titratable acidity, sample temperature | Comparable before/after readings |
| Water | Quality, pH, temperature and volume | Control curd washing |
| Starter | Culture batch, dose, time, pH curve | Check acidification consistency |
How to assign tasks to instruments
MilkoScan FT3 measures milk and dairy composition, including casein with the appropriate calibration. MilkoScan Mars is considered for routine composition checks; confirm each required parameter separately. MilkoScan does not replace a somatic cell counter.
BacSomatic provides separate bacterial and somatic cell counts in raw milk. These results do not identify every possible pathogen.
FoodScan 2 Dairy supports composition testing of finished cheese and other suitable dairy matrices. Connecting milk, process and cheese results is more useful than assigning every task to one instrument. Antibiotics, line hygiene and confirmatory microbiology require their own control programme.
How LabLog supports cheesemakers
LabLog Group helps businesses in Uzbekistan select testing methods and FOSS equipment for their sample load, milk types and laboratory tasks. We can discuss required parameters, suitable calibrations, commissioning and operator training.
For a consultation, prepare cheese varieties, processing volume, samples per shift, current methods and the problem to solve: variable yield, curd, acidification or losses. Numerical examples in this article do not replace your approved process instructions and production safety requirements.
FAQ
FAQ
Why is total protein not enough for cheesemaking milk?+
Milks with equal total protein can have different casein proportions. Rennet cheesemaking also depends on casein, fat, curd properties and whey losses. Verify actual yield using plant data.
Does MilkoScan count somatic cells?+
No. MilkoScan measures milk composition. Somatic cell counting requires a suitable counter, such as BacSomatic, which also measures bacterial count.
Is a 0.1 pH difference a mandatory limit?+
No. It is a working reference from the technical discussion, not a universal standard. Set limits and corrective actions for the product, method, measurement temperature and plant procedure.
When should a dry starter be assessed?+
Follow the supplier instructions and acidification curve. The 40–60 minute example from the technical discussion does not apply automatically to every culture or require prior rehydration.
Sources and documents
- Auldist et al., 1996 — somatic cells, lactation and Cheddar
- Paludetti et al., 2020 — Pseudomonas proteases and Cheddar quality
- Chadikovski et al., 2022 — whey type and Urda yield
- Tetra Pak — Dairy Processing Handbook: Cheese
- FOSS — MilkoScan 7 RM
- FOSS — MilkoScan FT3
- FOSS — BacSomatic
- FOSS — FoodScan 2 Dairy